
The Common Application recently released a report on trends in early college applications, and several member colleges have released their own admissions data for the Early Action and Early Decision pools. We have compiled some of the most notable facts and figures to help you understand the current admissions landscape, including trends in application numbers, diversity, standardized testing, and acceptance rates.
Application Numbers
According to the Common App, by December 1, 1,158,805 distinct first-year applicants had applied to 916 returning members for the 2025-26 admissions cycle, an increase of 4% from 1,110,937 at this point in last year’s cycle. The report also mentions that Application volume to returning members through December 1 rose 9% from 2024–25 (5,717,566) to 2025–26 (6,237,325). Students had also applied to more Common App member colleges through December 1 in 2025–26 than in 2024–25 (up 5% from 5.15 to 5.38 applications per applicant).
Diversity
The Common App defines “underrepresented minorities” as “students of Hispanic/Latino, African-American, Pacific Islander, and Native American origin or background.” The report stated that “Black or African American applicants (13%) and applicants identifying as Two or More Races (10%) saw the fastest growth compared to the prior season. Applicants identifying as an underrepresented minority race/ethnicity (URM) increased by 9% compared to this point in 2024-25.”
The number of international applicants decreased by 9% (compared to a 4% year-over-year increase in international applicants at this time during 2024-25). There was a pronounced drop in applicants from Asia (-10%) and Africa (-16%), with notable declines in applicants from India (-15%) and Ghana (-40%). There was the largest decline in applications from international applicants at institutions with admit rates between 50% and 74% (-18%) and those with admit rates of 75% or greater (-16%).
First-generation applicants grew by 11% compared to this point during 2024-25, while continuing-generation applicants increased by only 1%.
In terms of economic diversity, there was faster growth for students reporting eligibility for a Common App fee waiver (9% vs. 2%). This year also saw growth in applicants from below-median income ZIP codes, who continued to outpace their peers from above-median income ZIP codes at 11% growth compared to this point in 2024–25 (versus 3%).
Standardized Testing
The proportion of Common App members requiring standardized test scores since 2019–20 has changed significantly—from about 55% in 2019–20 to an all-time low of just 4% in 2023–24. This season, 5% of members require a test score to submit an application.
The report shows that the number of applicants reporting a test score continues to grow, with an 11% increase among reporters, while the number of nonreporters has decreased by 2% since this time during the 2024–25 season.
Acceptance Rates
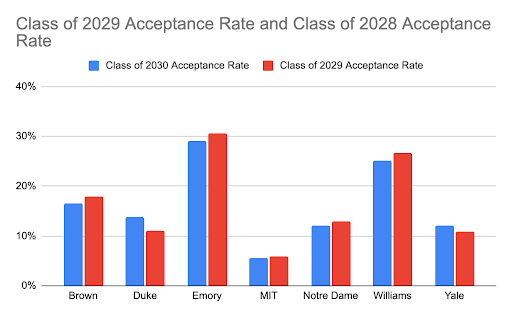
Admission to highly selective colleges and universities has only gotten more competitive in the last few years, and this year is no different. All of the colleges in the chart below have seen lower acceptances for Class of 2030 than they did for the Class of 2029.
Note that several schools have opted not to report their early action and early decision acceptance rates, including Barnard, Columbia, Cornell, Harvard, Northwestern, Stanford, University of Pennsylvania, and Princeton.
You’ve now familiarized yourself with the data and trends of this year’s early application cycle. If you’re applying to college in future cycles, make sure that the schools on your list are still a suitable fit for you. As you take the final steps in revising your essays and updating your activities list, use the data to your advantage and make the decision that’s best for you.
Leave a Reply