The Common Application recently released a report on trends in early college applications, and several member colleges have released their own admissions data for the Early Action and Early Decision pools. We have compiled some of the most notable facts and figures to help you understand the current admissions landscape, including trends in application numbers, diversity, standardized testing, and acceptance rates.
Application Numbers
According to the Common App, 904,860 distinct first-year candidates submitted applications to enroll in the 2025–26 academic year,. These students applied to 863 Common App member schools. These applicants submitted a total of 4,017,250 applications -a 10% increase compared to the applications received by November 1 in 2023.
Diversity
Underrepresented minority (URM) applicants increased by 16% in 1 2024–25, with fastest growth for applicants identifying as Latinx (17%) Black or African American (15%), and American Indian or Alaska Native (6%).
Applicants identifying as first-generation grew at a substantial rate of 19%, while continuing-gen applicants grew by 2% from 2023–24 to 2024–25. Growth was also faster for students reporting eligibility for a Common App fee waiver, which increased at over three times the rate of students not reporting fee waiver eligibility (13% vs.4%).
In terms of international student trends, growth in the number of international applicants (applicants who report exclusive, active citizenship for a country outside the U.S.) slightly fell behind growth in domestic applicants at 5% since 2023–24 (versus 7% for domestic
applicants). Growth is fastest among applicants with citizenship in Bangladesh (51%), Rwanda (41%), and Kazakhstan (30%). Additionally, the rapid growth in applicants from Africa since at least 2020–21 exhibited a downturn this season (-9% over the past year), and applicants from China are up (9% over the past year) for the first time since 2021–22.
Standardized Testing
The year-over growth in the number of applicants reporting test scores by November 1, 2024 outpaced those not reporting test scores for the first time since the 2021–22 season. This is despite only a nominal change in the proportion of Common App members with a test score requirement this season (up from 4% in 2023–24 to 5% this season).
Acceptance Rates
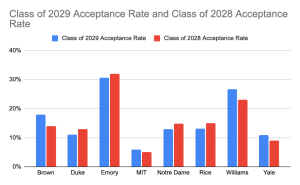
Although admission to highly selective colleges and universities has only gotten more competitive in the last few years, many schools saw a slight increase in acceptance rates than the 2023-24 admissions cycle.
Note that several schools have opted not to report their early action and early decision acceptance rates, including Barnard, Columbia, Cornell, Harvard, Stanford, University of Pennsylvania, and Princeton.

You’ve now familiarized yourself with the data and trends of this year’s early application cycle. If you’re applying to college in future cycles, make sure that the schools on your list are still a suitable fit for you. As you take the final steps in revising your essays and updating your activities list, use the data to your advantage and make the decision that’s best for you.
Leave a Reply