The Common Application recently released a report on trends in early college applications, and several member colleges have released their own admissions data for the Early Action and Early Decision pools. Keep reading for the highlights.
- The total number of college applications submitted increased again this year.
- In addition to seeing more applicants, individual applicants applied to more schools this year than in previous years.
- There was a greater increase in applications to public institutions than to private universities.
- There were major increases in the number of international, first-generation, low-income, and underrepresented minority students applying to college.
- Roughly half of students who applied submitted standardized test scores.
Application Numbers
Compared to 2019-20 (the last year with data unaffected by the pandemic), the total number of applications submitted through December 1 increased by 36%. Two factors contributed to the increase in applications: there were more individual applicants (+24%), and each applicant submitted more applications on average (+10%).
Interestingly, the increase in the number of applications per applicant favored public institutions. Applications to public universities increased by 47% compared to 25% for private colleges and universities.
Diversity
Underrepresented minority (URM) applicants increased by 37% compared to 2019-20. The Common App defines “underrepresented minorities” as “students of Hispanic/Latino, African-American, Pacific Islander, and Native American origin or background.”
The number of international applicants increased by 62% over 2019-20, compared to a 21% increase in domestic applicants. The countries with the most applicants were China, India, Nigeria, Ghana, and Canada.
First-generation applicants increased by 43%, more than double the rate of continuing-generation applicants.
Although 57% of domestic applicants in the early application rounds hail from the most affluent 20% of zip codes in the nation, there was a 56% increase in students reporting eligibility for a Common App fee waiver — this is indicative of an increase in applications from low-income students.
Standardized Testing
After some years of fluctuation, the percentage of college applicants who submit standardized test scores has settled at about half. Recent application cycles saw a steep decline in applicants reporting standardized test scores (from 75% in 2019-2020 to only 45% in 2020-2021) as more schools adopted test-optional policies during the pandemic. The following year’s application cycle saw 48% of applicants reporting scores, and trends for the current 2022-2023 cycle suggest the same rate this season.
As with previous seasons, URM, first-generation, and fee waiver recipient applicants were less likely to report scores (39%, 35%, and 35% reported respectively). Applicants identifying as female were also less likely to include test scores than those identifying as male (at a rate of 43% vs 53%).
Acceptance Rates
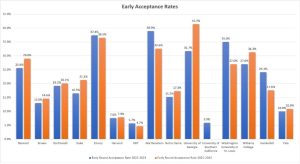
Admission to highly selective colleges and universities has only gotten more competitive in the last few years, and this year is no different. While a few colleges have reported higher admit rates this year than last, the overall trend is still toward lower admit rates.
Note that several schools have opted not to report their early action and early decision acceptance rates, including Columbia, Cornell, Stanford, University of Pennsylvania, and Princeton.

*University of Virginia has separate early admission rates for in-state and out-of-state applicants. In the 2022-23 cycle, the in-state Early Decision admit rate was 31.1% (compared to 37.8% in 2021-22), while the out-of-state Early Decision admit rate was 17% (compared to 25.1% in 2021-22).
**USC added an Early Action option for the first time in 2022-23.
Leave a Reply